Study area
This project was conducted in a tropical dry forest -- Santa Rosa National Park Environmental Monitoring Super Site (SRNP-EMSS), located in the northwest of the Guanacaste province in Costa Rica (10°48′53″N, 85°36′54″W) (Figure 3). SRNP-EMSS is a mosaic of diverse vegetation communities with pastures and secondary forests in different successional stages. It is worthy mentioning that many forest patches are infested by lianas at the SRNP-EMSS. Based on the classification map of successions (Zhao et al. 2021), twenty-seven of the plots 45m * 45m were selected along a transect of the successional path (Intermediate – Transition II – Late) to capture forest structure differences. The reason why no plots were selected in early stage forest and transition I is that (1) we can see only small areas of early succession and transition I (yellow and light green areas) are present (Figure 3b); (2) abundant species diversity, and variability in forest structure are expected in intermediate and late successional stages.

Figure 3. (a) The study area at the Santa Rosa National Park Environmental Monitoring Super Site (SRNP-EMSS), Guanacaste, Costa Rica. (b) The classification map of successional gradients for the SRNP-EMSS, and it also shows the distribution of plots along the successional path (Intermediate, Transition II, and Late). Data source: University of Alberta, Centre for Earth Observation Sciences.
Data collection
|
In addition to the classification map of successional stages at the SRNP-EMSS, a colorized small footprint (1m * 1m) full-waveform airborne LiDAR data set was used in this project. The main goal of using this LiDAR data is to extract forest structure parameters and derive various metrics for subsequent analysis. The full-waveform LiDAR data set was acquired on May 21, 2021, by Stereocarto (Madrid, Spain) using a RIEGL LMS-Q680i LiDAR sensor. The platform mounted the LiDAR sensor and used for the execution of flight is an aircraft (Figure 4). The subsets for 27 plots (Figure 3) distributed in the intermediate successional stage, transition II, and the late successional stage (Figure 3) were clipped from original LiDAR datasets.
|

Figure 4. The aircraft was used to collect LiDAR data at the SRNP-EMSS.
|
Methods

Figure 5. The schematic describes the coordinate of centroid (Cx and Cy), the radius of gyration (RG), and the location of maximum waveform amplitude (Px and Py) based on the Leaf Area Density profile waveform (after Muss et al. 2013).
|

Figure 6. The formula to calculate radius of gyration (RG).
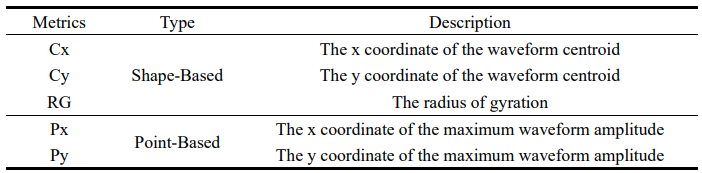
Table 1. Description of five metrics used in this project.
|
From LiDAR data for 27 plots, forest structure parameters such as canopy height and leaf area density (LAD) can be derived directly (These can be achieved by specific software such as LiDAR 360 or the corresponding R package. In this project, all data processing are achieved in R). When plotting these two variables in the line chart, different waveform for each plot can be observed (Figure 5). Three shape-based (Cx, Cy, and RG) and two point-based metrics (Px and Py) were derived from the LAD profile as described in Figure 5 and Figure 6. A simple description of these metrics was contained in Table 1. In detail, C represents the centroid and is also called the center for mass in physics, which could be visualized as “the balance point” of the waveform. Detecting the waveform's shape and distribution relative to the ground in the LAD profile through centroid is feasible. RG is the root mean square of the sum of distances for all points, expressed as the formula (Figure 6). RG would fluctuate with the relative area of each peak in the waveform’s modality, and it also allows an understanding of how the waveform is distributed around its centroid. This permits using of the waveform’s shape better than just the centroid itself. Besides, Px and Py (x and y coordinates of the maximum waveform amplitude, respectively) were also used to capture waveform distribution features.
